Debugging with Emergence BASIC is done through a specially compiled version of your program to embed source and line number information into the executable. Debug executables are not meant for general distribution and should not be used for any other purpose except finding problems with your code.
Creating a debug executable
Before an application can be debugged it must be built in debug mode.
For single file compiling check the "Debug build" checkbox in the Executable options dialog when creating the executable. The setting will be remembered each time you compile so be sure to uncheck the box when you are finished debugging and build a normal application.
For projects change the project options by selecting the Project menu and choosing Options, then check the "Debug build" checkbox and save the project. Rebuild you project by selecting the Build menu and choosing Rebuild All
Starting the debug session
Once a debug executable has been created start the debug session by selecting the Build menu, choosing Debug and finally choosing Start. Alternately you can press F9 or click the debug start button on the toolbar.
The IDE will change to debug view in the output window and attempt to debug the executable. Watch the debug view window for informational messages such as DLL's being loaded, any exceptions, and output from the DEBUGPRINT function. If an exception or breakpoint is encountered the debugger will stop the execution of the program being debugged and the IDE will enter debug operations mode.
Stopping the debug session
At any time you can end the program being debugged while it is running by selecting the Build menu and choosing Debug->Stop. Alternately click the stop button on the toolbar. After the debug session is over the IDE will return to normal mode and you can make any changes to your code, rebuild and debug again if necessary.
Controlling the debugger
The debugger will pause execution of your program any time it encounters a system exception or a breakpoint set with the STOP statement. At this time the "Debug Context Display" window will open as well as the source file containing the line where execution was paused. The line will be highlighted for ease of identifying.
If the program was paused due to a STOP command you can continue execution where it left off by Selecting the Build menu and choosing Debug->Continue, pressing F9 or clicking on the debug start/continue button in the toolbar.
A program that generates a system exception such as an access violation cannot be continued and must be restarted. The source file and line number will be shown to allow determining where the fault occurred.
Single stepping
After a programs execution has been paused with a STOP statement you can single step one line at a time by selecting the Build menu and choosing Debug->Single Step, pressing the F10 key or clicking on the single step toolbar button.
The context display
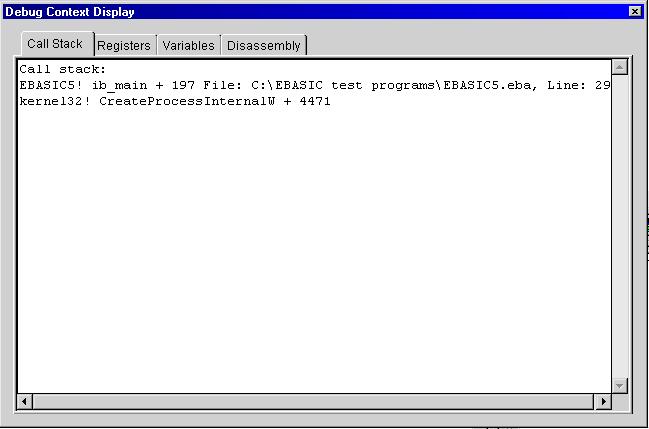
As mentioned above whenever an error occurs or your program is paused by the STOP statement the Debug Context Display window will open. This window shows the values of all CPU registers including floating point, the call stack, the source and line numbers where the pause occurred, local and global variables, and the disassembly of instructions where the execution was stopped.
The call stack shows the subroutines execution has traversed to get to the current point of execution. For example if SubroutineA calls SubroutineB and a STOP statement is located in SubroutineB the call stack might look like:
EBASIC5! SubroutineB + 13 File: C:\EBASIC test programs\EBASIC5.eba, Line: 43
EBASIC! SubroutineA + 111 File: C:\EBASIC test programs\EBASIC.eba, Line: 27
kernel32! CreateProcessInternalW + 4471
Each line in the call stack provides the information of:
executable name! Subroutine name + offset in bytes File: Source file name Line: line number in file
The first line in the call stack is always the last point of execution before the error or STOP. Source file and line number information will only be available for programs and projects compiled in debug mode. They will not usually be available for DLL's or other system code as indicated above. They are also not available in the linker libraries used by the compiler itself.
See figure 1 for an example context display.
Outputting data to the debug view
While your program is running under a debugging session you can display information in the debug view of the IDE by using the DEBUGPRINT statement. DEBUGPRINT accepts one string parameter which can be used to display the contents of variables while the program is running, or to display state information to aid in following the execution path. For example:
DEBUGPRINT "Program starting"
DEBUGPRINT "A=" + STR$(A)
error = MyFunction(27)
DEBUGPRINT "MyFunction returned: " + STR$(error)
DEBUGPRINT is most useful right before a STOP statement to dump variable contents to the debug view.
Preparing your source for debugging
When building in debug mode the compiler automatically defines the preprocessor symbol DEBUG. You can use this symbol to create conditional compiling based on regular or debug mode. Using conditional compiling ensures that no debugging references are left in your code for a normal build of your executable. Using the example from above:
$IFDEF DEBUG
DEBUGPRINT "Program starting"
DEBUGPRINT "A=" + STR$(A)
$ENDIF
error = MyFunction(27)
$IFDEF DEBUG
DEBUGPRINT "MyFunction returned: " + STR$(error)
$ENDIF
For more information on conditional compiling and the preprocessor of the compiler see: Conditional compiling
Figure 1: Sample context display